The screener
See it in action
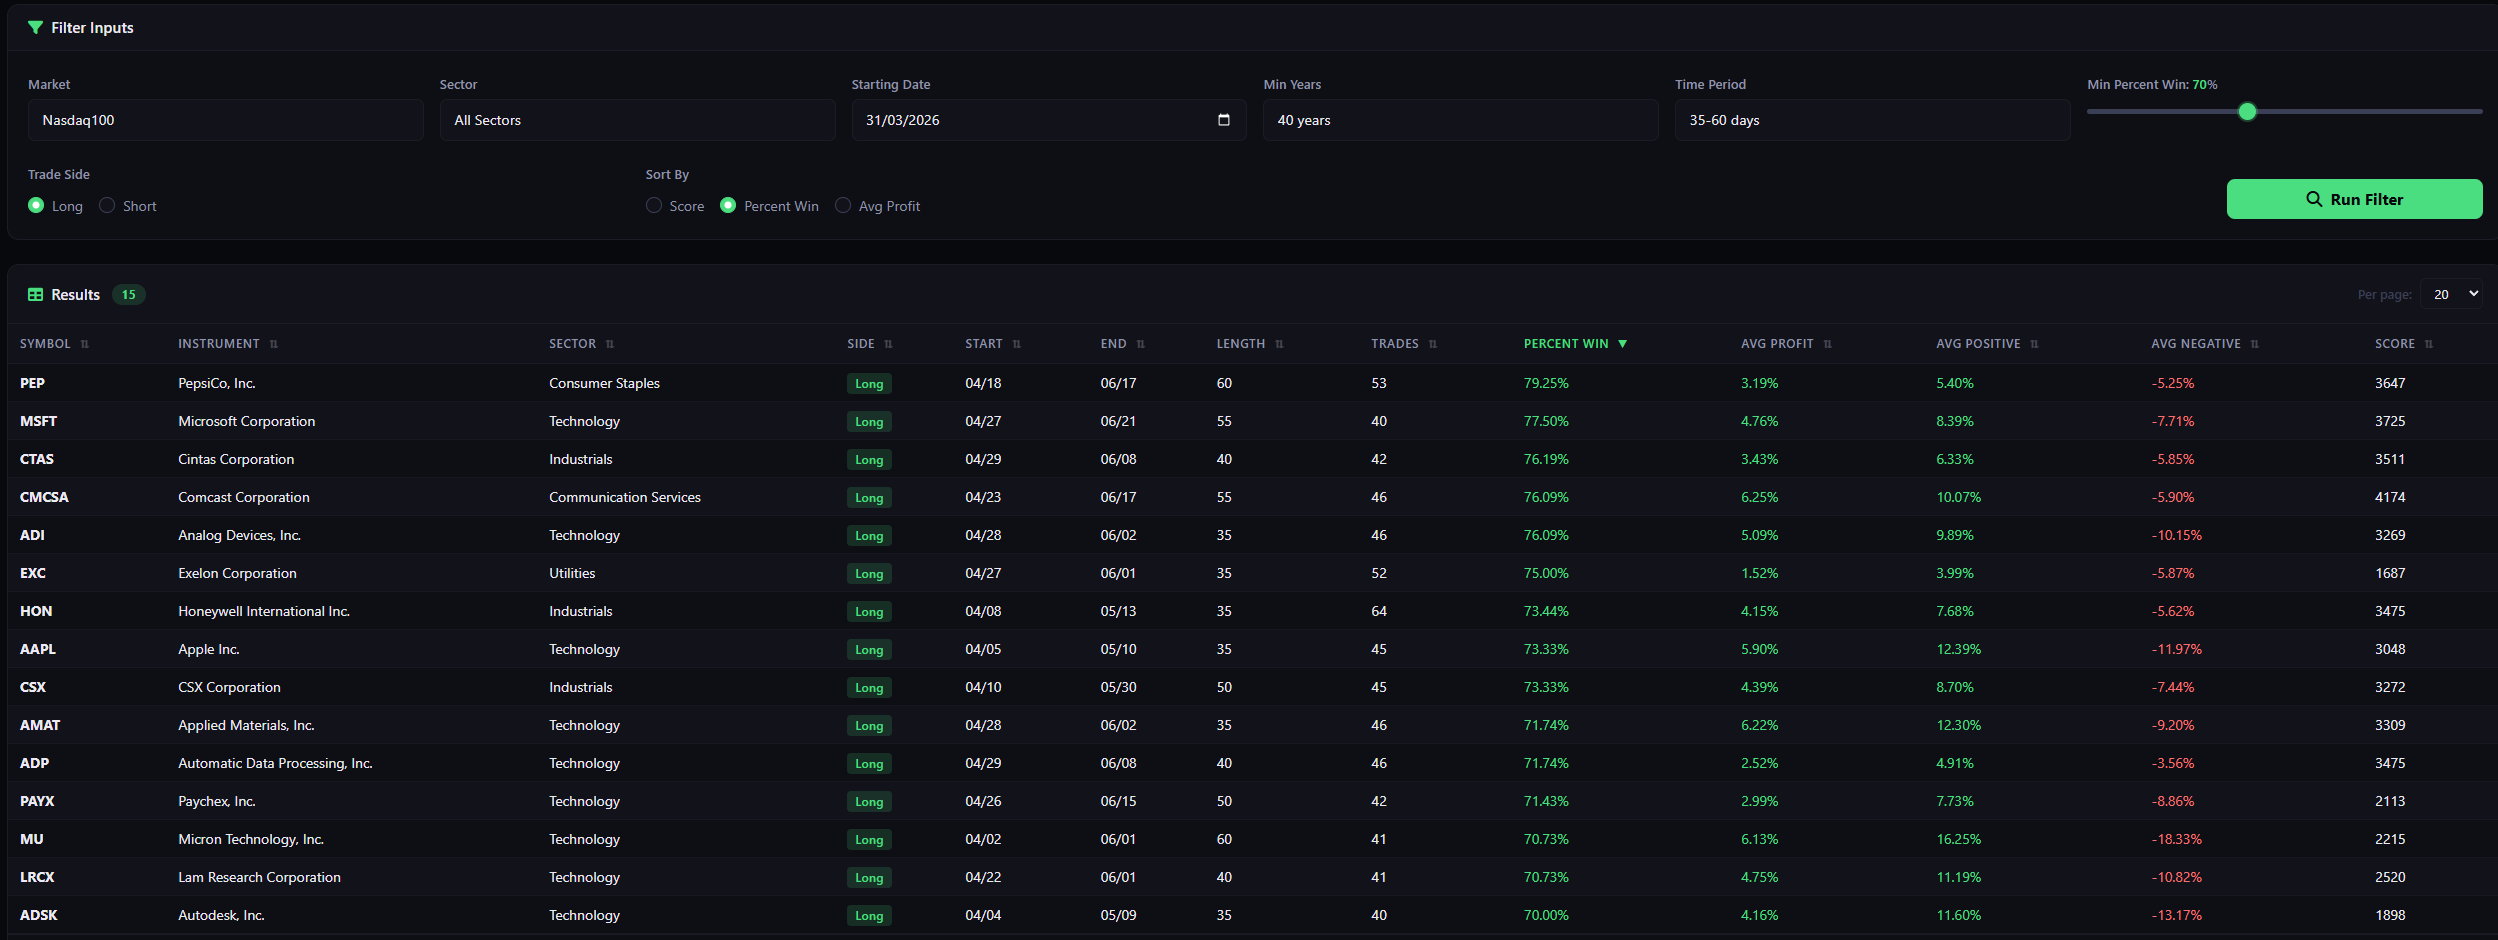
Screen thousands of stocks, inspect every pattern, and trade only what the data supports.
Markets are not random. Prices tend to rise or fall during the same calendar periods year after year — driven by earnings cycles, macro events, and investor behaviour that repeat predictably.
A stock that rises every January for 25 of the last 30 years is not luck — it reflects a structural tendency. Seasonality captures these repeating windows and quantifies their reliability.
Earnings seasons, dividend schedules, tax deadlines, commodity harvest cycles, and fund rebalancing all create predictable price pressure on specific instruments at specific times of year.
Seasonal trades do not win 100% of the time. The edge comes from identifying windows where the historical win rate is high enough — and the average gain large enough — to tilt probability in your favour.
Seasonal analysis is used as a timing layer on top of fundamental or technical views. A trader bullish on energy stocks can use seasonality to identify the specific weeks when energy historically performs best — entering with higher conviction and a defined exit window.
It is also used independently as a systematic strategy: screen for the strongest seasonal windows each month, filter by win rate and average profit, and build a diversified calendar of trades across sectors and asset classes.
For each instrument and date window, SeasonHunter computes the historical win rate (how often the trade was profitable), the average profit %, the maximum intra-trade rise, and the maximum drawdown — giving you a full risk/reward picture before you commit capital.
SeasonHunter also unlocks a deep-dive analysis — automatically scanning thousands of window combinations to surface the single strongest seasonal opportunity for each month of the year, so you always know where the next edge is before the calendar turns.
"The best seasonal trades combine a high win rate, a meaningful average gain, and solid metrics robustness. This creates consistent performance across years and not just a handful of outlier results."
Seasonal trading principleScreen thousands of stocks, inspect every pattern, and trade only what the data supports.
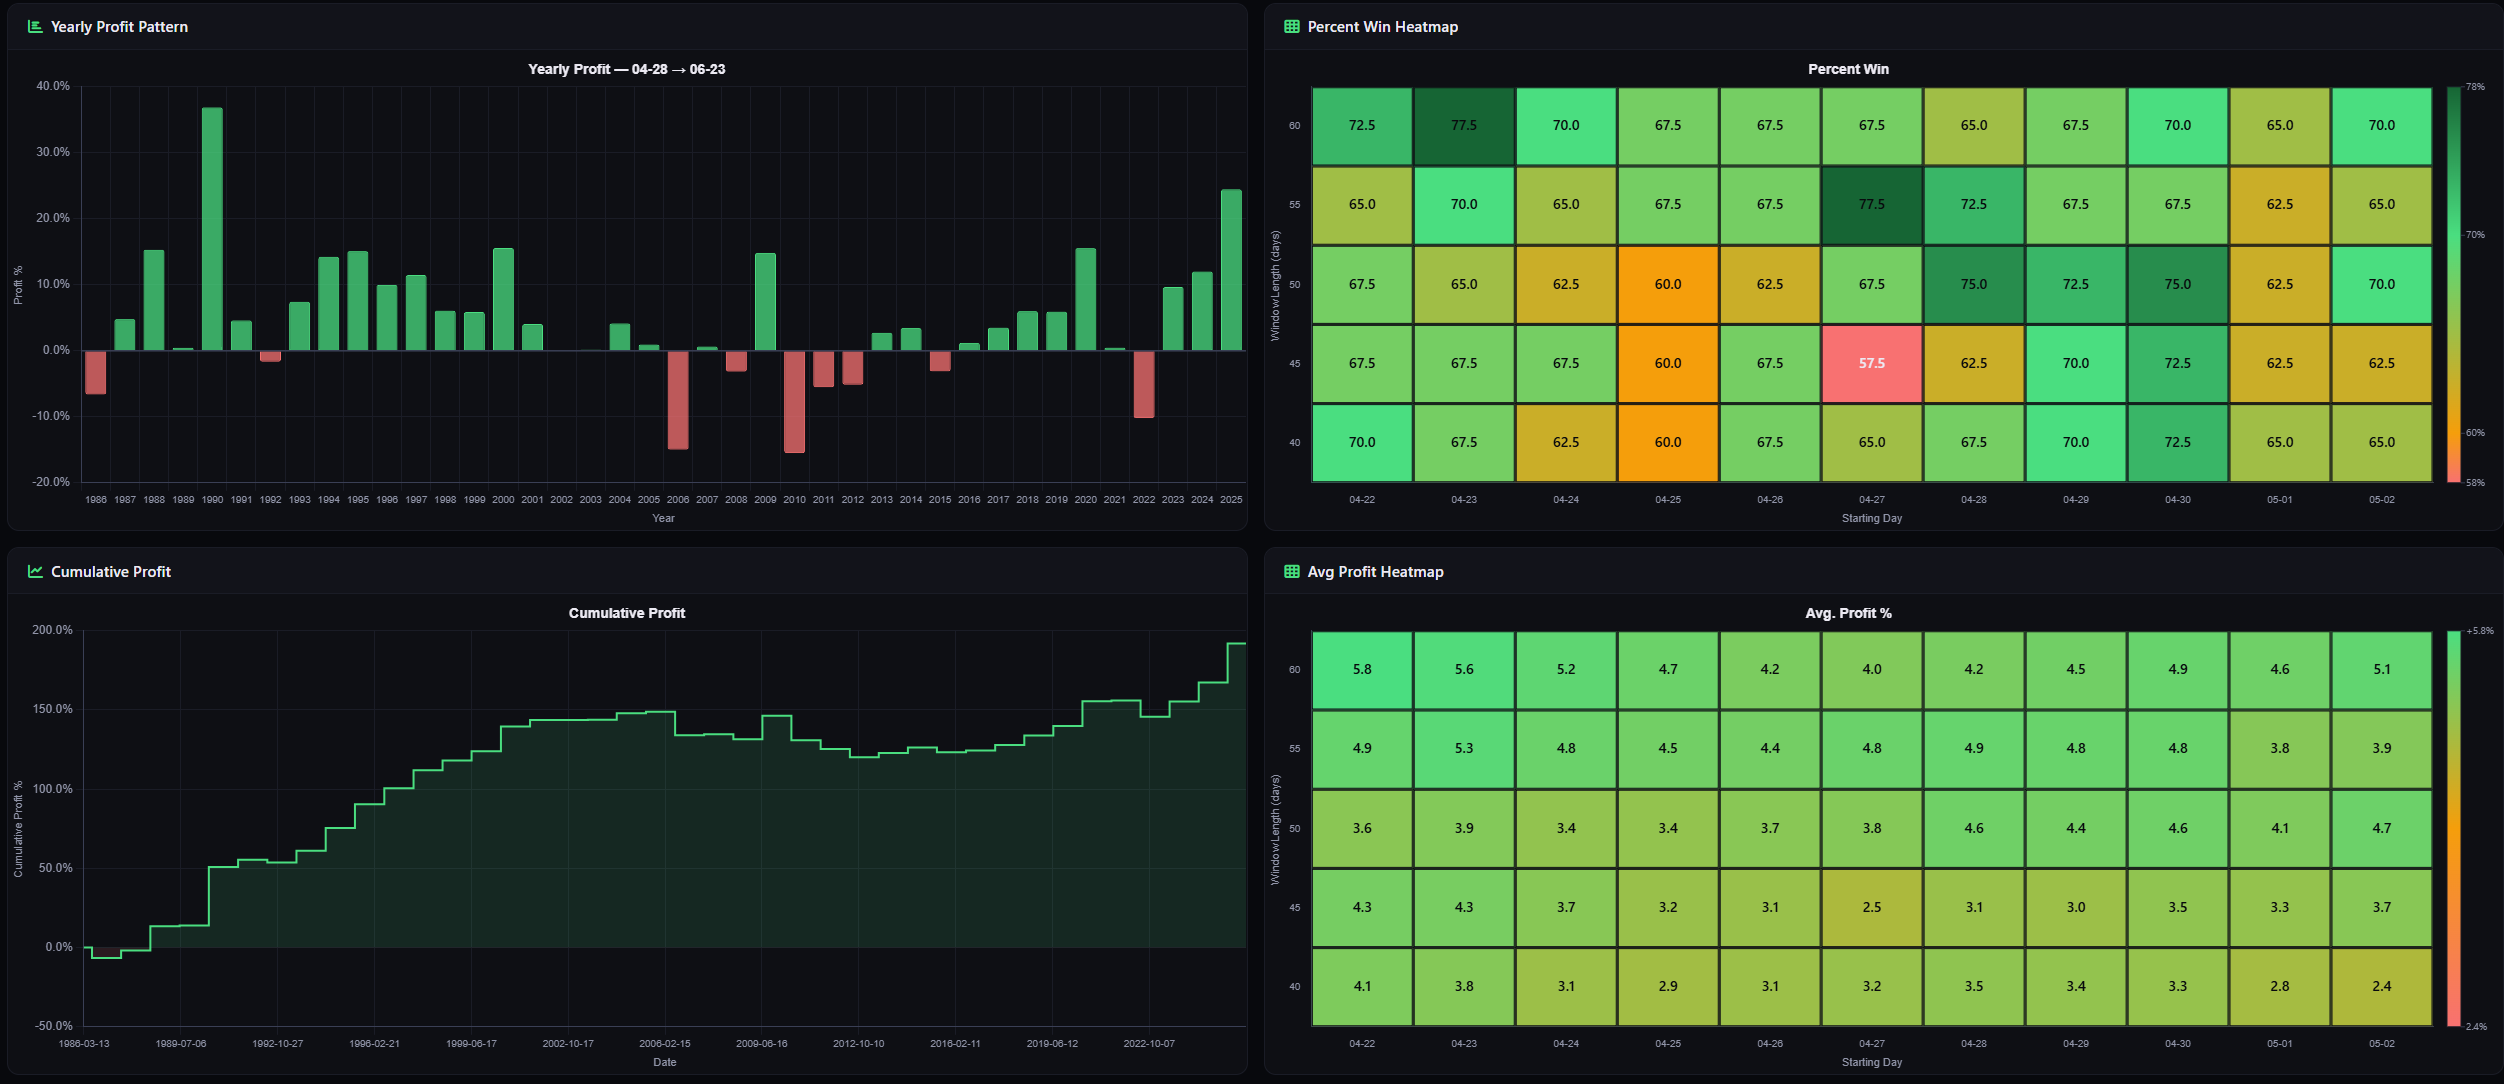
Select any result from the screener and instantly see the full picture: year-by-year performance, cumulative profit curve, monthly heatmaps. The key metrics that define the strength of the seasonal pattern.
Select any instrument and instantly see when it moves.
The Pattern Scanner ranks the strongest seasonal window for every month of the year.
Then backs it up with statistical rigour: percentile analysis, consistency scores, and historical depth
so you know exactly how durable the edge is before opening a position.
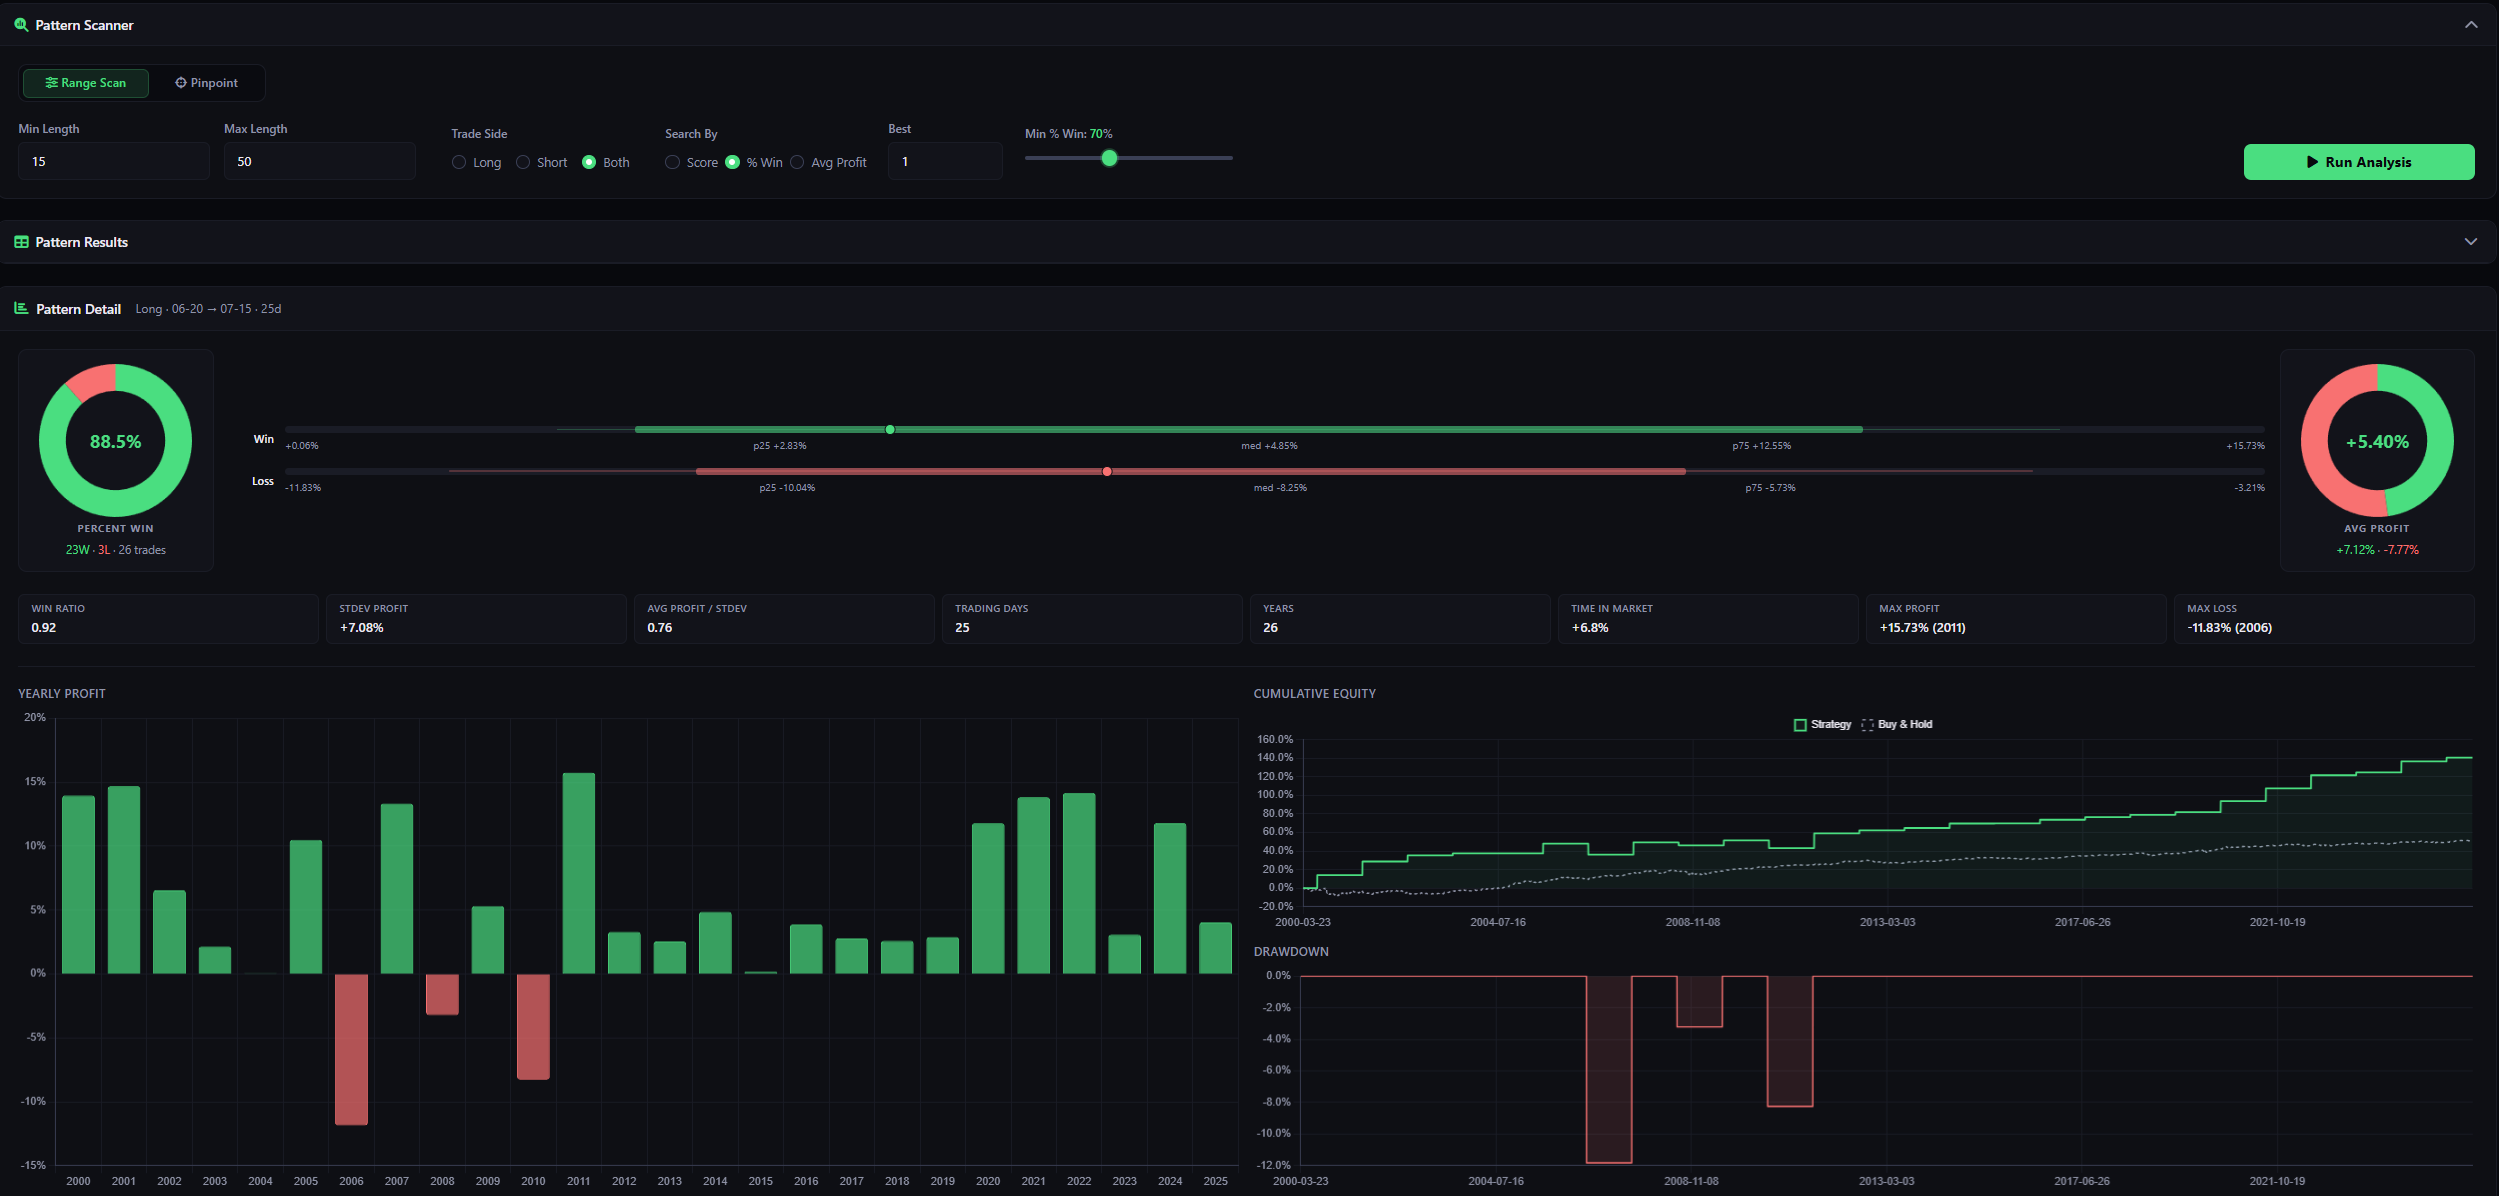
Every tool you need lives in a single view. No switching tabs, no missing context, no guesswork. From the seasonal tendency chart to the year-by-year trade log and equity curve, you get the complete risk/reward picture before you commit a single dollar.
Free accounts include the screener and seasonal charts. Upgrade for full trade analytics.
Free trial included · No credit card required