Built by Traders
for traders who want data driven decisions
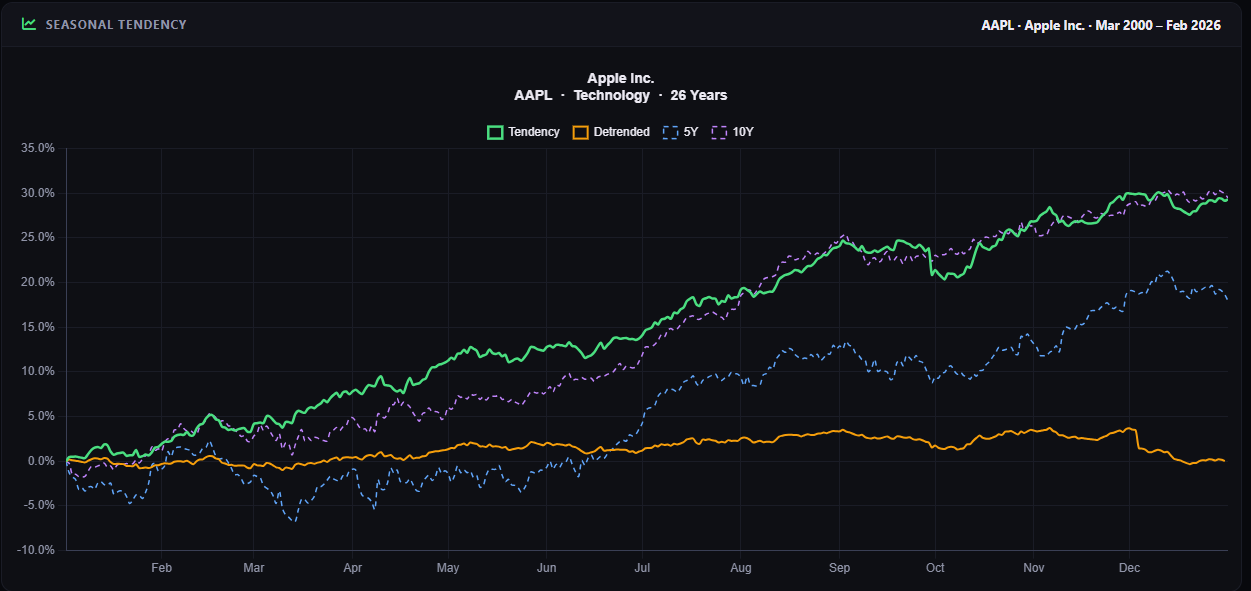
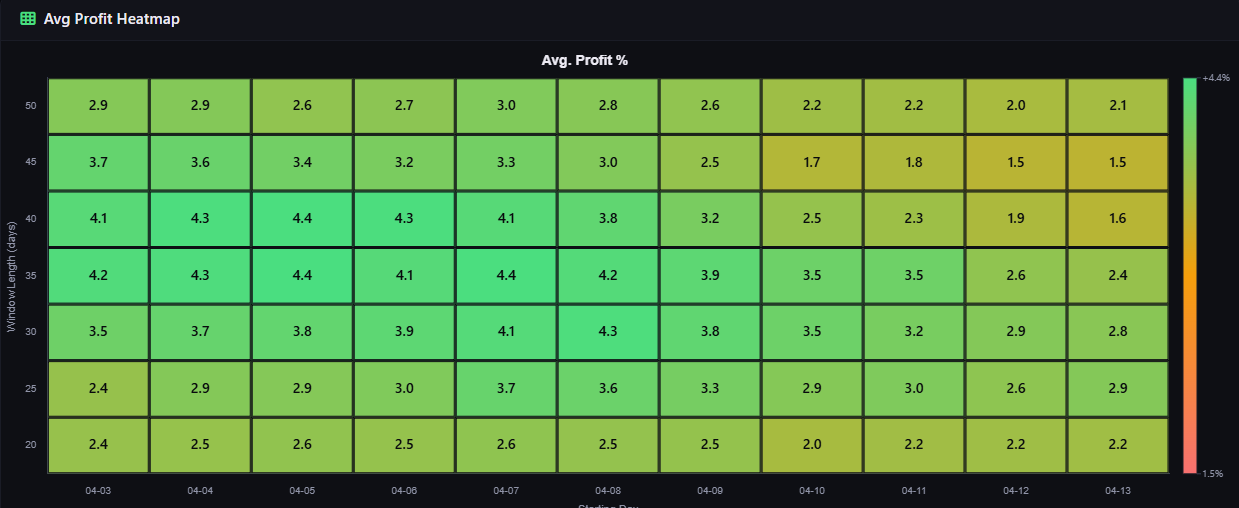
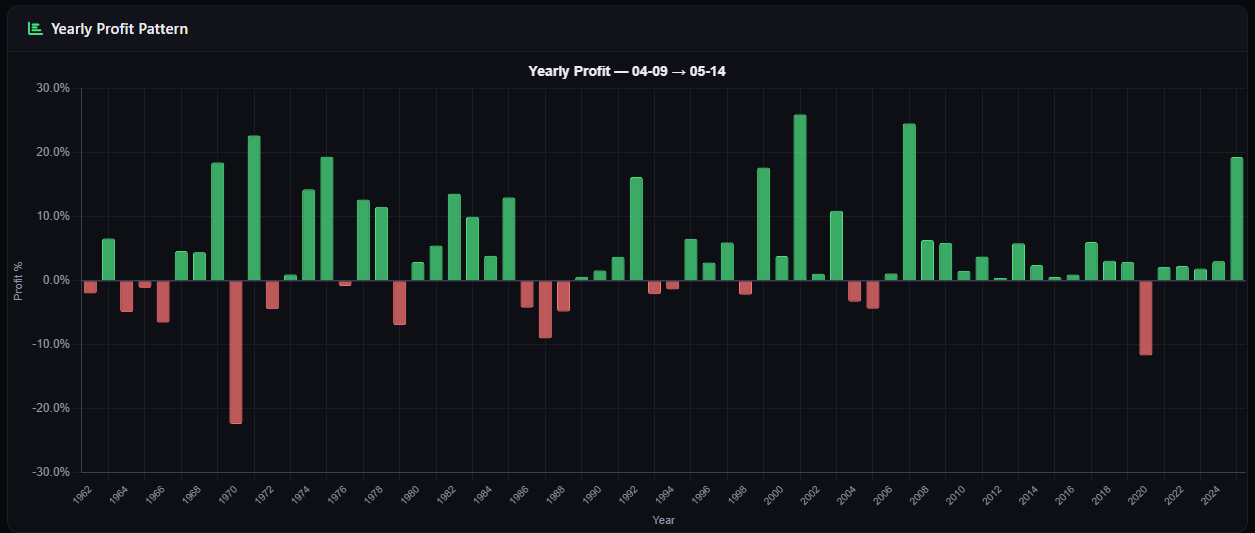
Find seasonal trends
hidden in the market
SeasonHunter screens thousands of financial instruments for historically recurring seasonal patterns — so you know which trades tend to win, when to open them, and when to close.
Free trial included · No credit card required